728x90
반응형
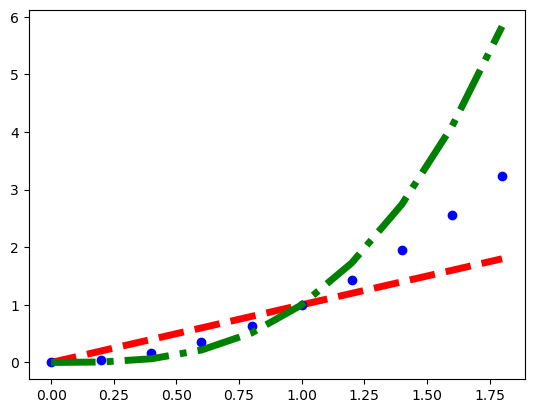
하나의 Axes의 여러 그래프 그리기
plot([x], y, [fmt], [x2], y2, [fmt2], ..., **kwargs) 방식
키워드 매개변수가 모든 그래프에 똑같이 적용된다.
plt.plot(a, a, 'r--',
a, a**2, 'bo',
a, a**3, 'g-.',
)
plt.show()

plt.plot(a, a, 'r--',
a, a**2, 'bo',
a, a**3, 'g-.',
lw=5
)
plt.show()
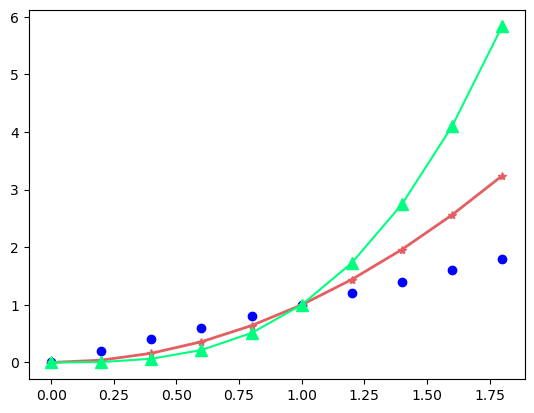
plot() 메소드를 여러번 호출
각각의 그래프마다 마커와 선을 다르게 설정할 수 있다.
plt.plot(a, a, 'bo')
plt.plot(a, a**2, color='#e35f62', marker='*', linewidth=2)
plt.plot(a, a**3, color='springgreen', marker='^', markersize=9)
plt.show()
하나의 Figure에 여러개의 Axes를 그리고 싶을 때 - 레이아웃 나누기
**Gridspec**
# 추천하는 방법 gridspec
fig = plt.figure()

# gridspec #
gs = fig.add_gridspec(2, 2)

ax1 = fig.add_subplot(gs[0, 0])
ax2 = fig.add_subplot(gs[1, 0])
# spans two rows:
ax3 = fig.add_subplot(gs[:, 1])

ax1.set_title('ax1')
ax2.set_xlabel('ax2')
ax3.set_title('ax3')

plt.show()
fig = plt.figure()
gs = fig.add_gridspec(2, 2)
ax1 = fig.add_subplot(gs[0, 0])
ax2 = fig.add_subplot(gs[0, 1])
# spans two columns:
ax3 = fig.add_subplot(gs[1, :])

ax1.set_title('ax1')
ax2.set_title('ax2')
ax3.set_xlabel('ax3')

plt.show()
subplots(nrows, ncols) 함수를 호출하고 리턴되는 Axes 배열객체를 사용하여 그리기
fig, ax = plt.subplots(2, 2, figsize=(5, 5))
ax[0, 0].plot(range(10), 'r') # row=0, col=0
ax[1, 0].plot(range(10), 'b') # row=1, col=0
ax[0, 1].plot(range(10), 'g') # row=0, col=1
ax[1, 1].plot(range(10), 'k') # row=1, col=1
plt.show()
Figure 객체의 add_subplot(nrows, ncols, index) 메서드를 호출하고 리턴되는 Axes 객체를 사용하여 그리기
fig = plt.figure(figsize=(5, 5))
ax1 = fig.add_subplot(2, 2, 1)
ax1.plot(range(10), 'r') # row=0, col=0
ax2 = fig.add_subplot(2, 2, 2)
ax2.plot(range(10), 'g') # row=0, col=1
ax3 = fig.add_subplot(2, 2, 3)
ax3.plot(range(10), 'b') # row=1, col=0
ax4 = fig.add_subplot(2, 2, 4)
ax4.plot(range(10), 'k') # row=1, col=1
plt.show()
subplot(nrows, ncols, index) 함수를 호출한 후 plot() 함수를 사용하여 그리기
fig = plt.figure(figsize=(5, 5))
plt.subplot(2,2,1)
plt.plot(range(10), 'r')

plt.subplot(2,2,2)
plt.plot(range(10), 'g')

plt.subplot(2,2,3)
plt.plot(range(10), 'b')

plt.subplot(2,2,4)
plt.plot(range(10), 'k')

plt.show()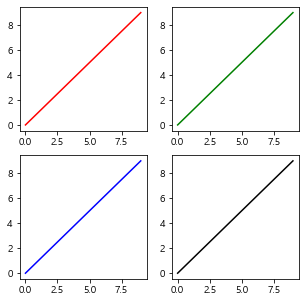
names = ['group_a', 'group_b', 'group_c']
values = [1, 10, 100]

plt.figure(figsize=(9, 3))

plt.subplot(131)
plt.bar(names, values)

plt.subplot(132)
plt.scatter(names, values)

plt.subplot(133)
plt.plot(names, values)

plt.suptitle('Categorical Plotting')
plt.show()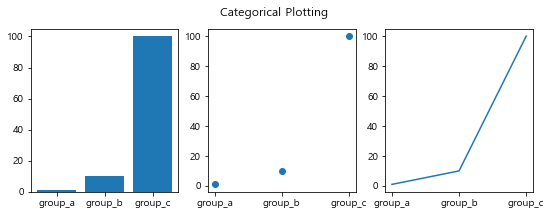
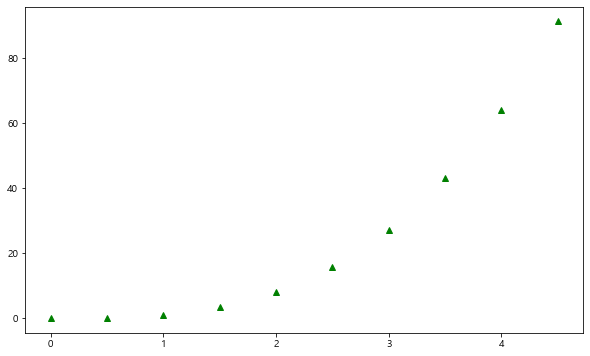
별개의 Figure로 각각 나눠 그리기
# 각각의 Figure 객체를 생성한 후에 그리는 것이므로 레이아웃을 나눈 것이 아님 - 별개의 그림이 됨
t = np.arange(0, 5, 0.5)
print(t)
plt.figure(figsize=(10,6))
plt.plot(t, t**2, 'bs')

plt.figure(figsize=(10,6))
plt.plot(t, t**3, 'g^')

plt.show()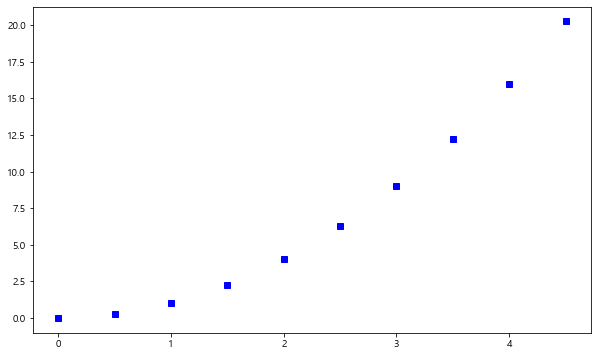
728x90
반응형
'Python 파이썬 > matplotlib' 카테고리의 다른 글
| matplotlib ) Figure, Axes 설정 (0) | 2022.03.25 |
|---|---|
| matplotlib ) 라인 플롯(line plot) 스타일 지정 (0) | 2022.03.22 |
| matplotlib ) 맷플롯립 개요 & 한글 폰트 오류 해결 (0) | 2022.03.21 |


댓글