728x90
반응형
회귀(regression)선이 있는 산점도(scatter plot) ; regplot
import matplotlib.pyplot as plt
import seaborn as sns

titanic = sns.load_dataset('titanic')

fig = plt.figure(figsize=(15,5))
gs = fig.add_gridspec(1,2)
ax1 = fig.add_subplot(gs[0,0])
ax2 = fig.add_subplot(gs[0,1])

# 선형회귀선이 표시된 그래프 그리기 ( fit_reg = True 기본값 )
sns.regplot(x='age', y='fare', data=titanic,
		ax=ax1,	# Axes 지정
        line_kws={'color':'red'} # 선형회귀선 속성 추가
        )

# 선형회귀선이 미표시 ( fit_reg = False )
sns.regplot(x='age', y='fare', data=titanic,
	ax=ax2,
    fit_reg=False
    )
plt.show()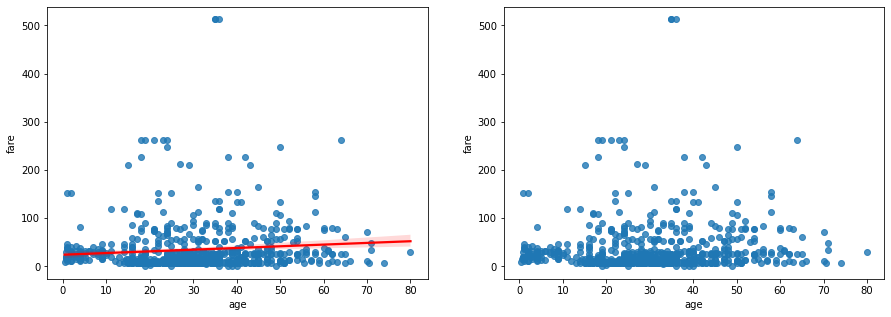
lmplot
regplot과 facegrid를 합친 것으로 regplot을 범주형 데이터로 한 번 더 나누어서 보고 싶을 때 쓴다.
import matplotlib.pyplot as plt
import seaborn as sns

tips = sns.load_dataset('tips')

plt.figure(figsize=(6,6))
sns.lmplot(
	x="total_bill", y="tip", data=tips,
    hue="smoker", # 범주형 데이터로 색 나누어표시
    markers=['o','x'], # 마커변경
    palette=dict(Yes="g", No="m") # 범주형 데이터별 색 지정
    # palette='Set1' 로 간단히 색을 바꿀 수도 있다.
)
plt.show()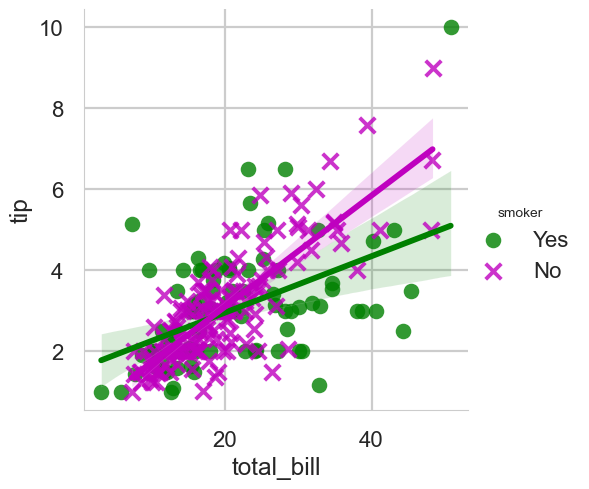
그래프를 따로 표시하고 싶을 때
sns.lmplot(x="total_bill", y="tip", data=tips,
	col="smoker" # axes를 나누어준다.
)
plt.show()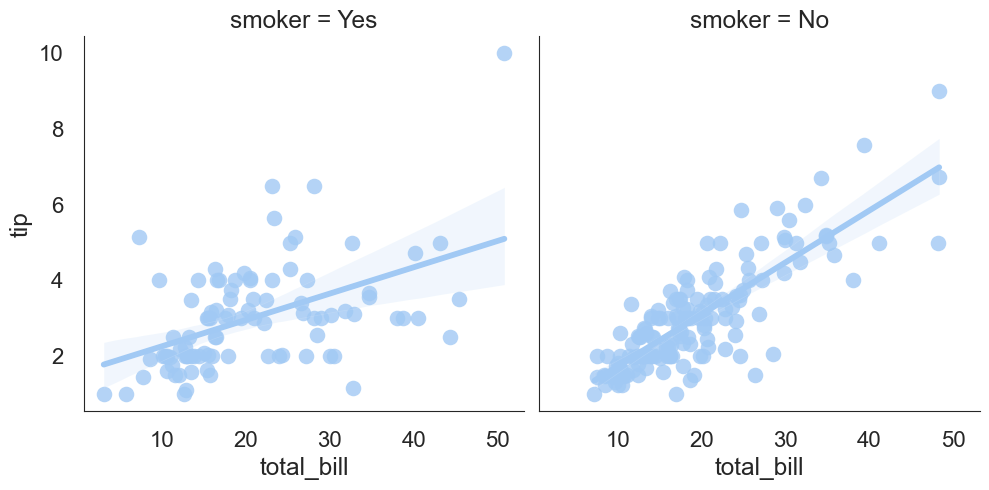
sns.lmplot(x="total_bill", y="tip", data=tips,
	col="day", # Axes 나눔
    hue="day", # 색 표시 나눔
	col_wrap=2, # 한 행의 표시할 컬럼 수
	height=3 # 높이 지정
)
plt.show()
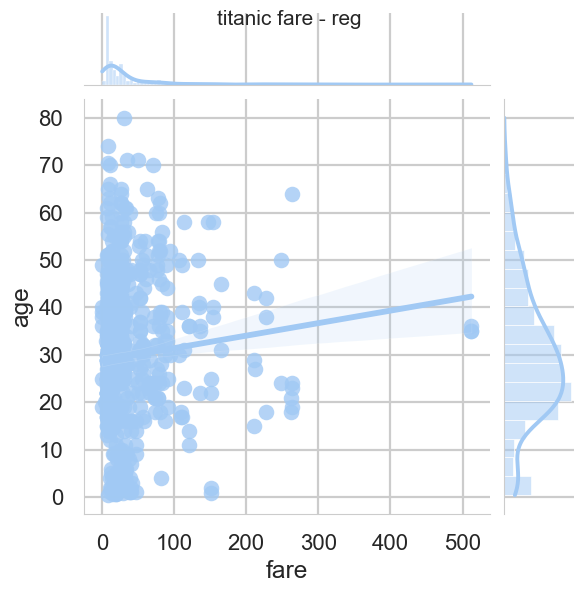
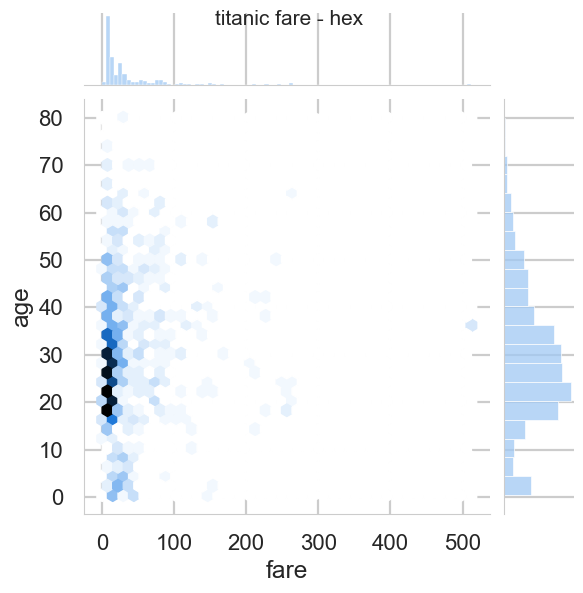
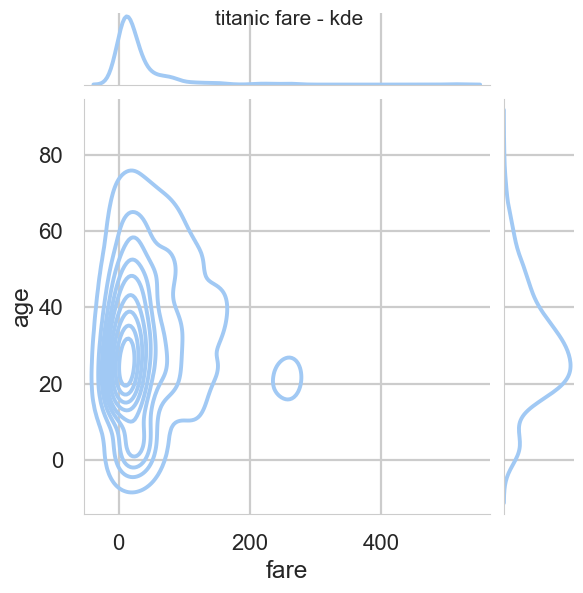
조인트 그래프
산점도를 기본으로 표시하고, x-y축에 각 변수에 대한 단변수 데이터 분포를 보여준다.
# 라이브러리 불러오기
import matplotlib.pyplot as plt
import seaborn as sns

# Seaborn 제공 데이터셋 가져오기
titanic = sns.load_dataset('titanic')

# 스타일 테마 설정 (5가지: darkgrid, whitegrid, dark, white, ticks)
sns.set_style('whitegrid')

# 조인트 그래프 - 산점도(기본값)
j1 = sns.jointplot(x='fare', y='age', data=titanic)

# 조인트 그래프 - 회귀선
j2 = sns.jointplot(x='fare', y='age', kind='reg', data=titanic)

# 조인트 그래프 - 육각 그래프
j3 = sns.jointplot(x='fare', y='age', kind='hex', data=titanic)

# 조인트 그래프 - 커럴 밀집 그래프
j4 = sns.jointplot(x='fare', y='age', kind='kde', data=titanic)

# 차트 제목 표시
j1.fig.suptitle('titanic fare - scatter', size=15)
j2.fig.suptitle('titanic fare - reg', size=15)
j3.fig.suptitle('titanic fare - hex', size=15)
j4.fig.suptitle('titanic fare - kde', size=15)

plt.show()
728x90
반응형
'Python 파이썬 > seaborn' 카테고리의 다른 글
| seaborn ) 한 개의 Figure에 여러 Axes 적용 (0) | 2022.03.30 |
|---|---|
| seaborn ) 단변수 데이터의 분포 그래프 (0) | 2022.03.30 |
| seaborn ) 범주형 데이터의 분포 시각화 (0) | 2022.03.29 |
| seaborn ) 막대 그래프 (0) | 2022.03.28 |
| seaborn ) 소개 (0) | 2022.03.28 |


댓글